Pablo Campuzano
<
Back to design
ÁRBOL*ÁREA
Role:
Data visualization designer
Tools and Skills:
Figma, Processing, data visualization
Bogotá is a deeply heterogeneous city. Depending on where you live, you might think it has almost no trees, or that it is one of the greenest cities you know. Both experiences are true, and that gap is the problem this visualization tries to close.
Using open data from the Mayor's Office of Bogotá and the Botanical Garden, which contains a record of every urban tree in the city, I designed and coded a visualization in Processing that abstracts the relationship between trees and people. The core idea is simple: how many trees exist for every person in each locality, and what does that actually feel like at a human scale.
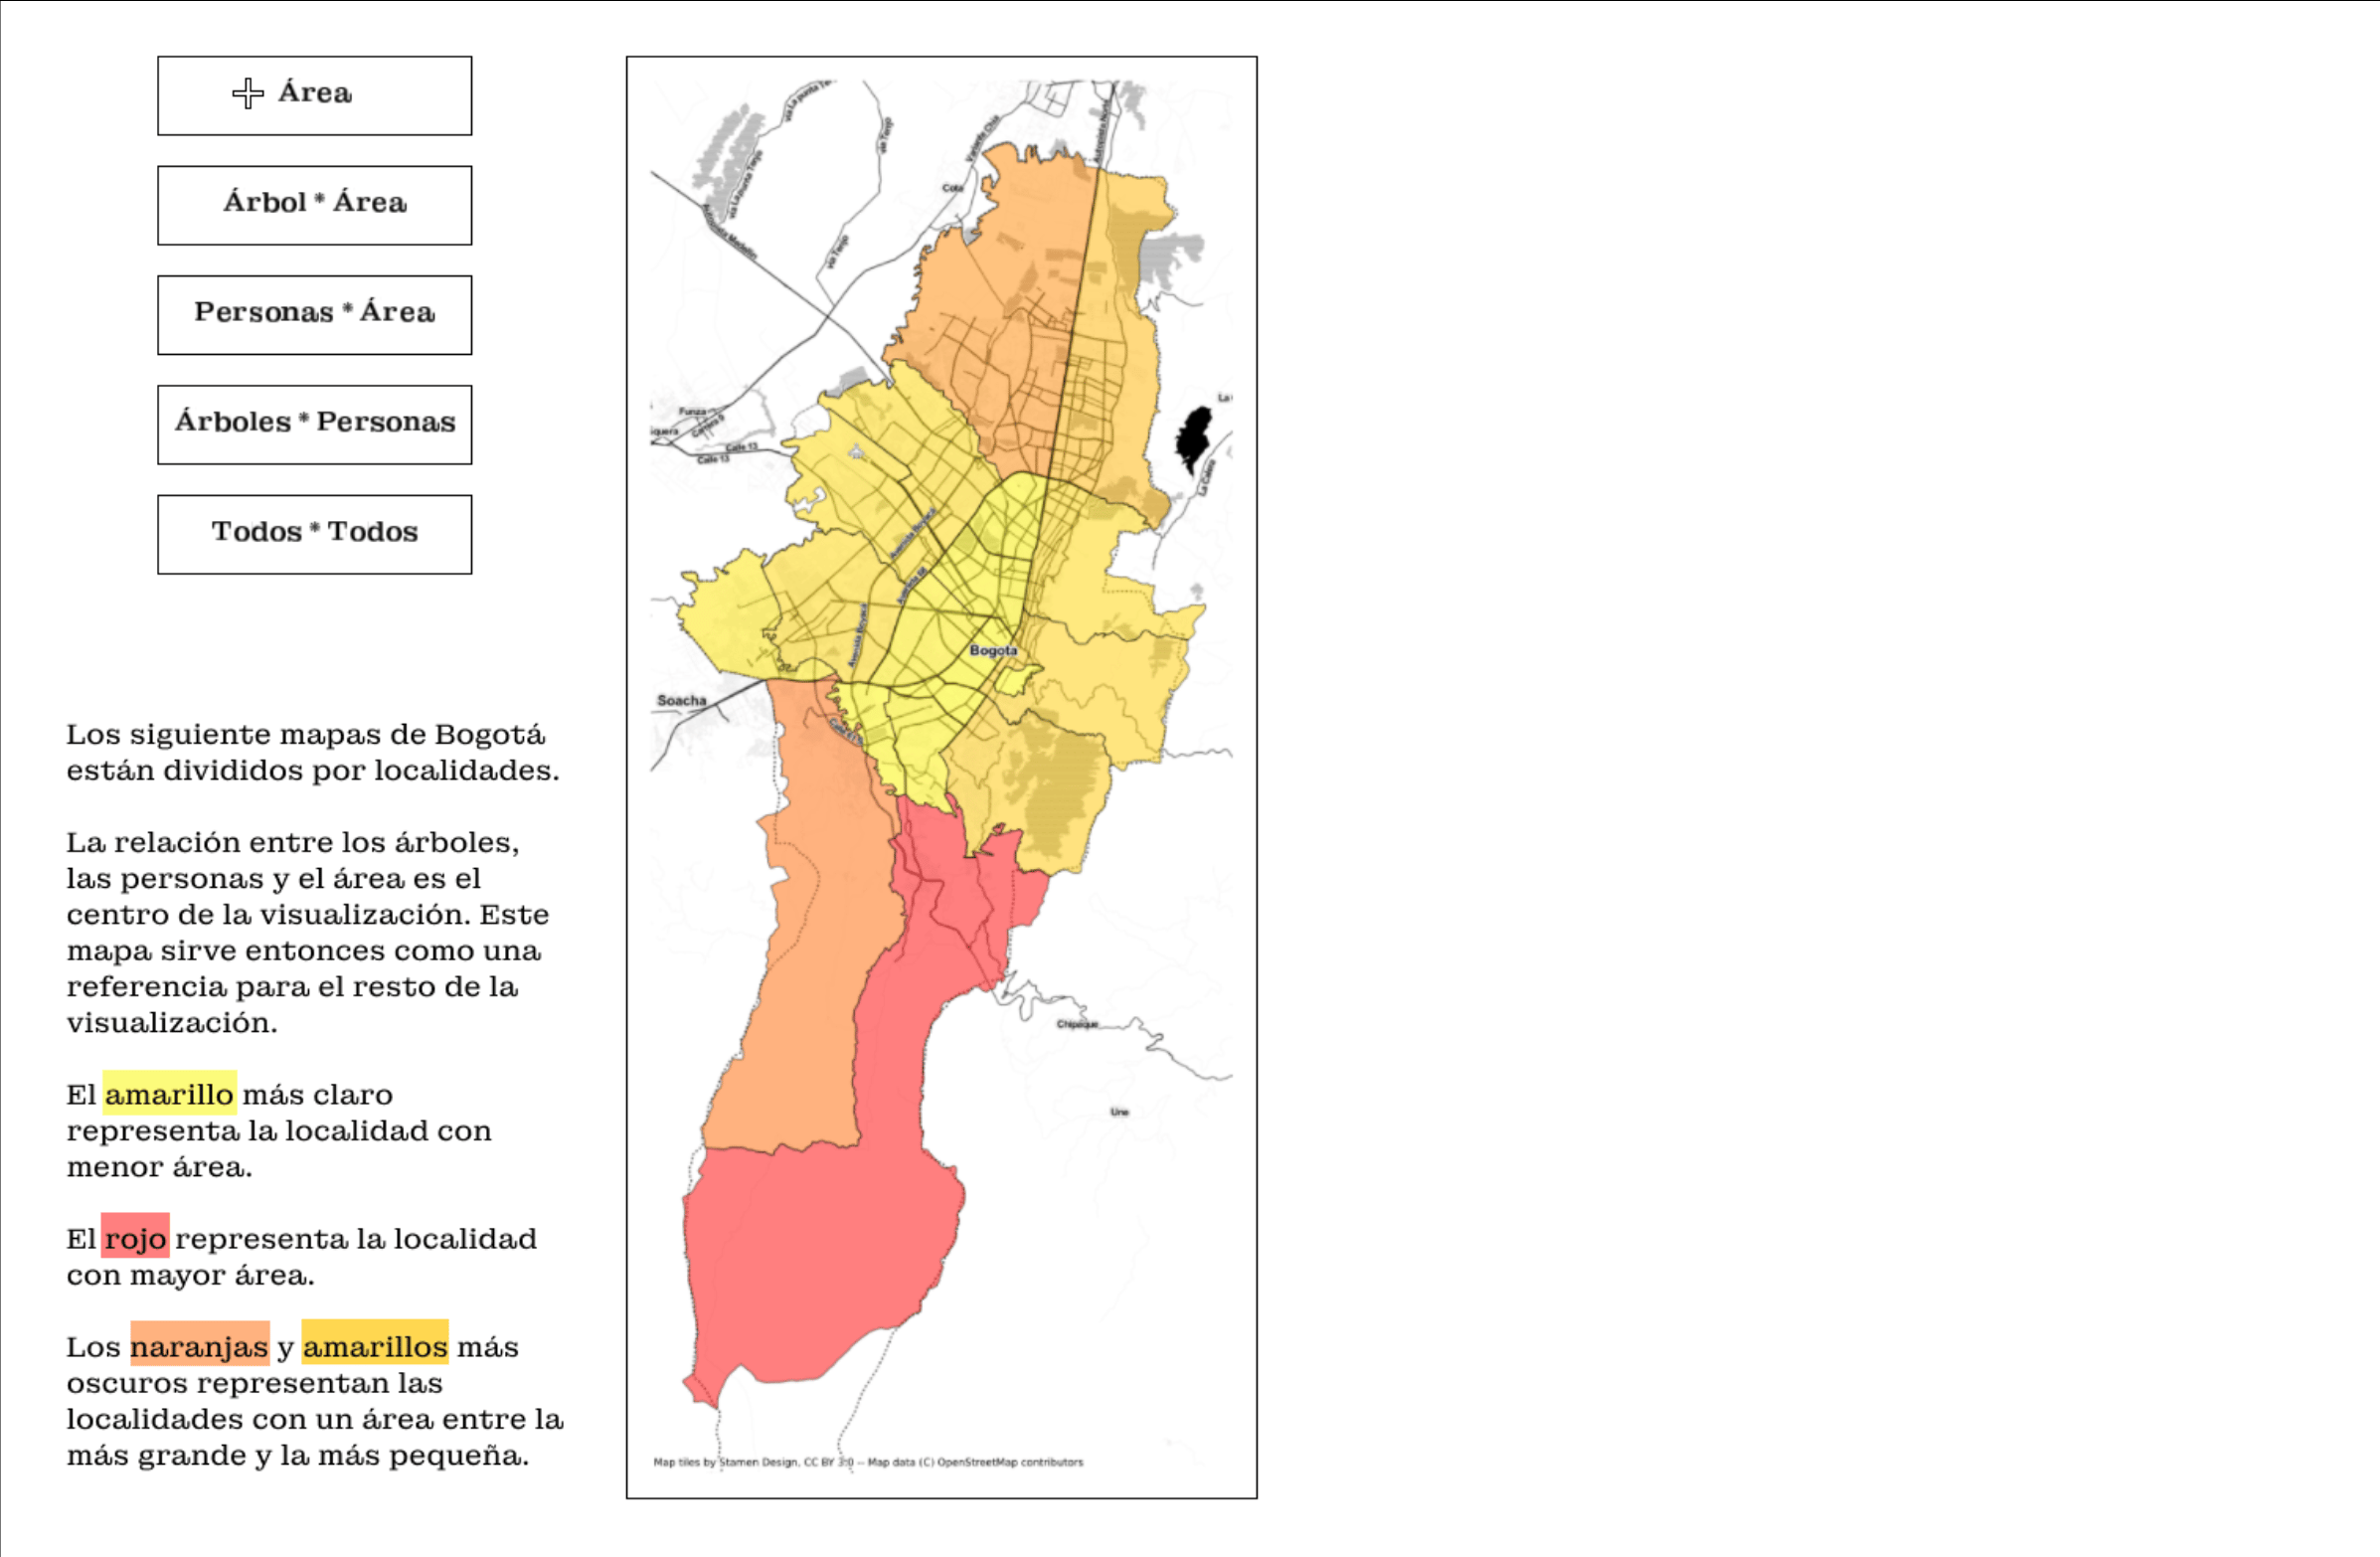
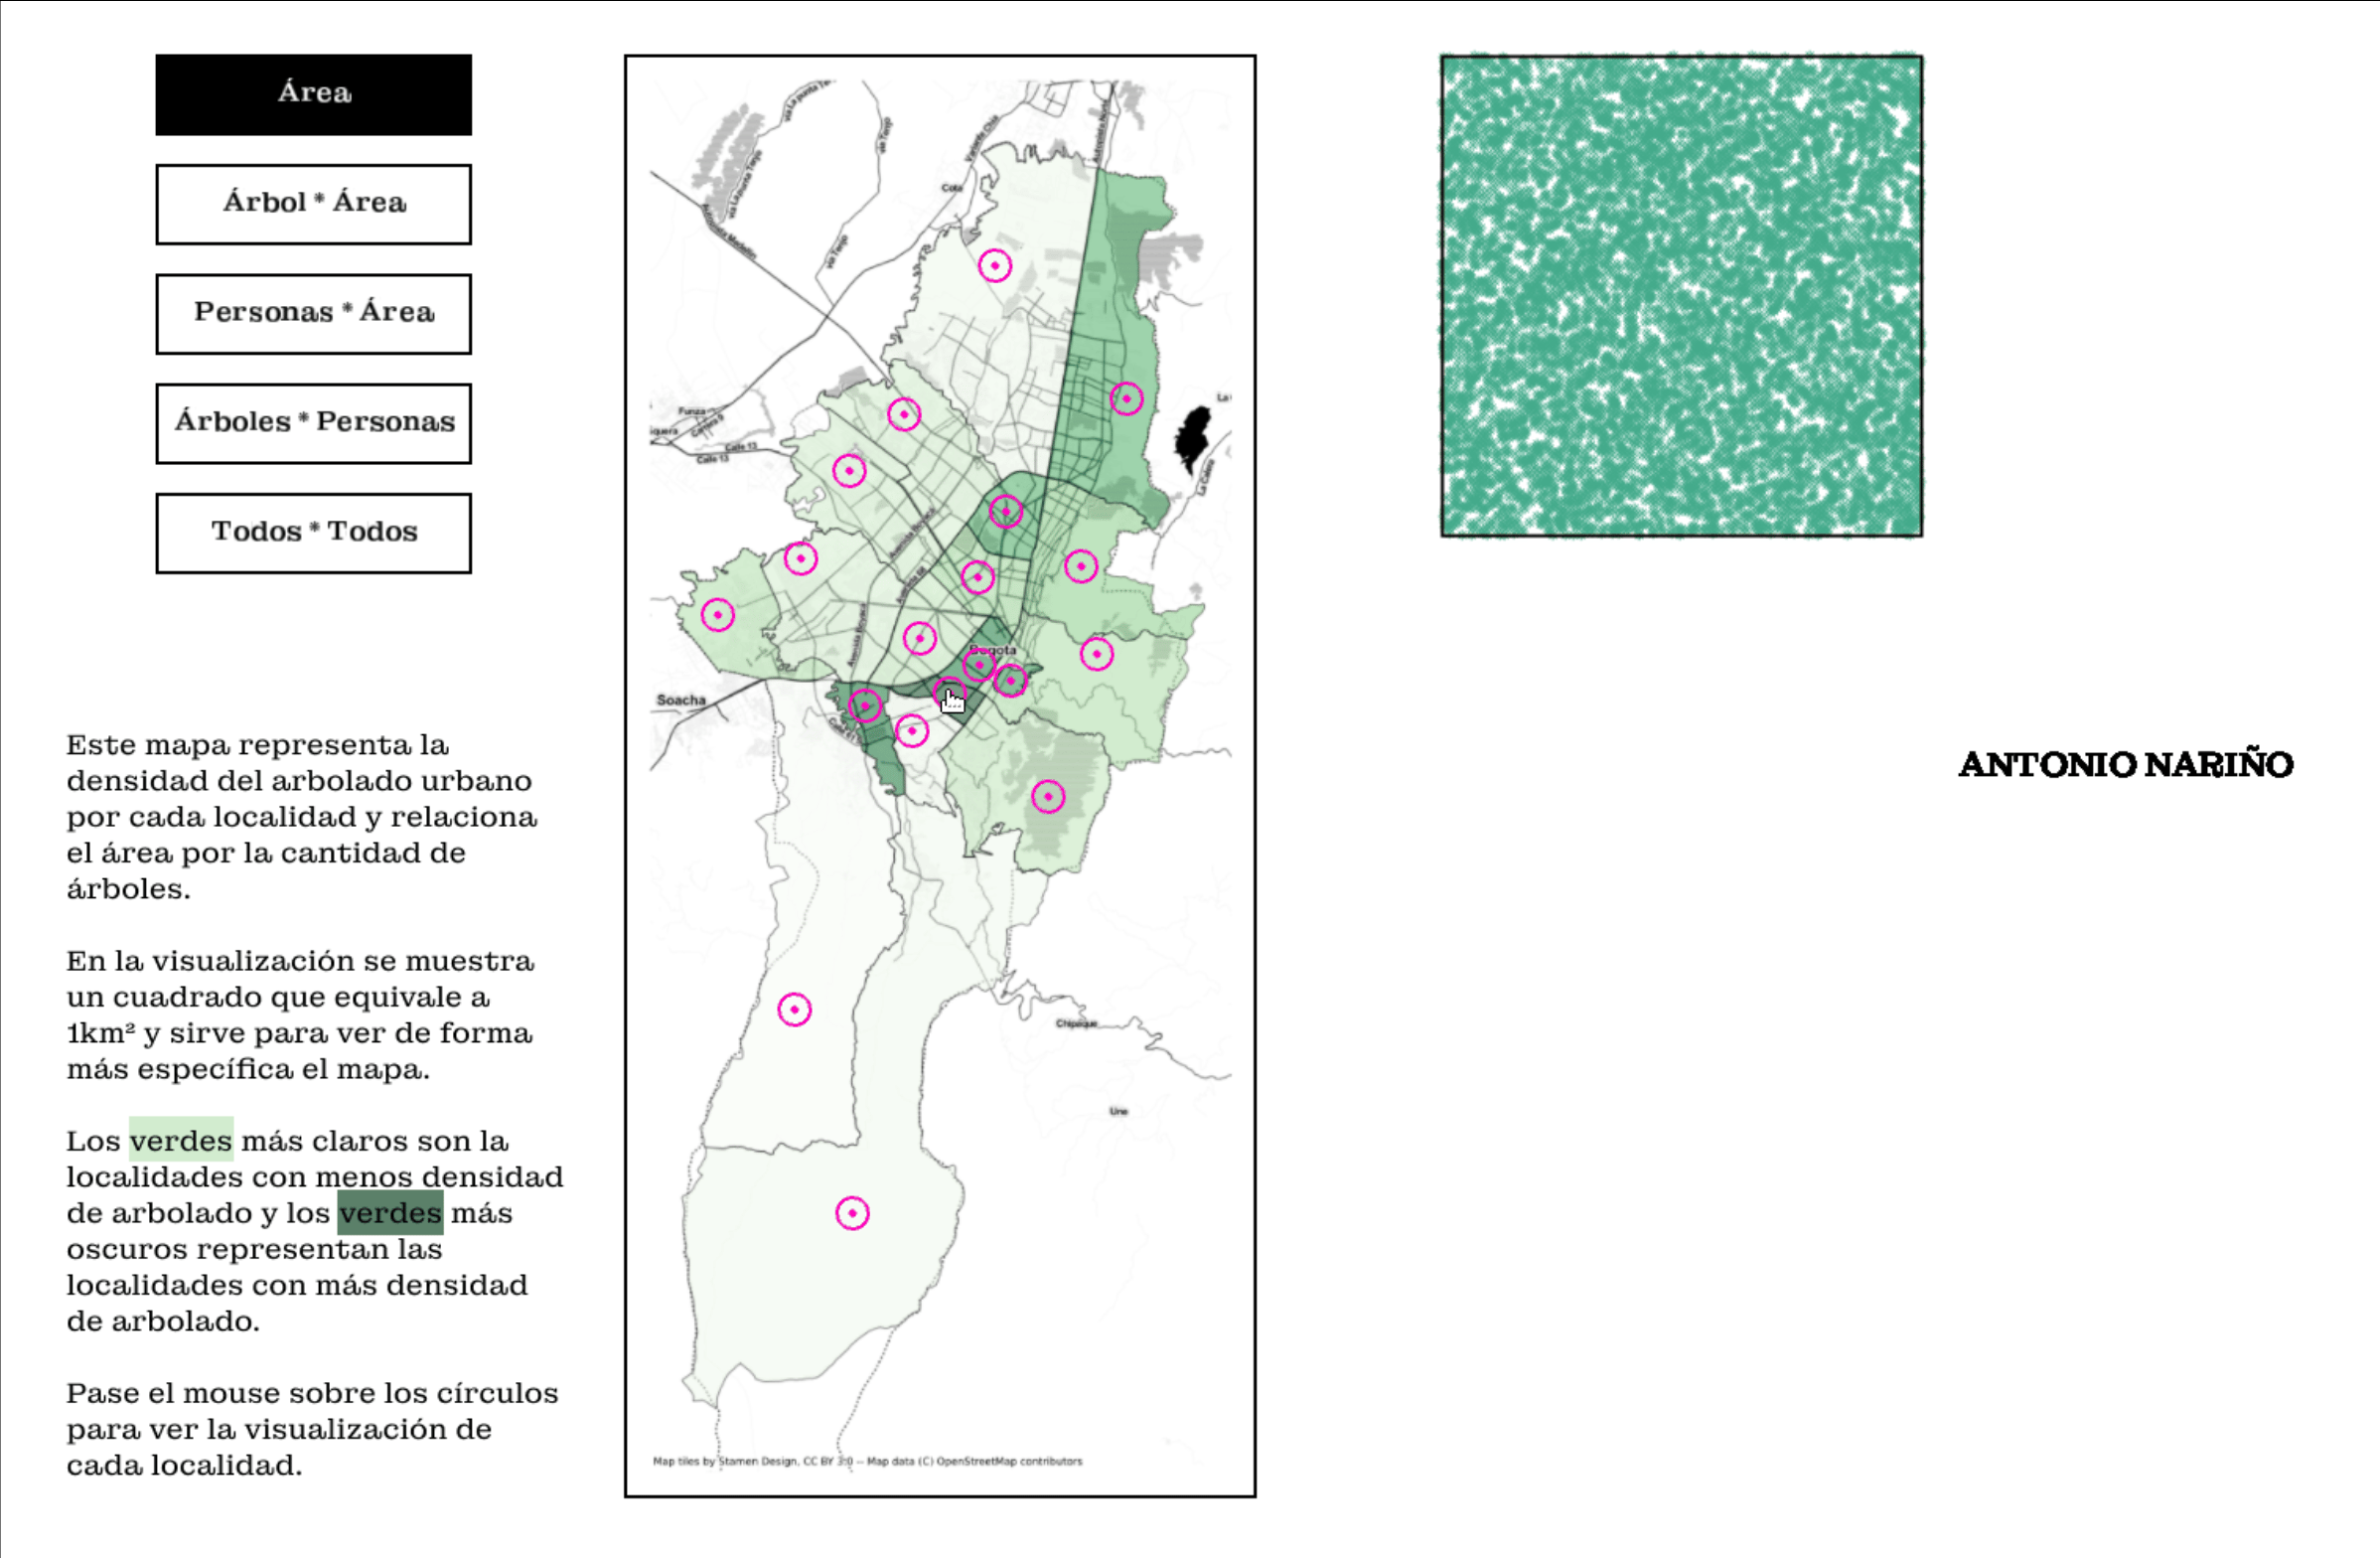
Tree density per locality
The first layer maps each locality's area against its tree density, revealing how unevenly urban green infrastructure is distributed across the city.
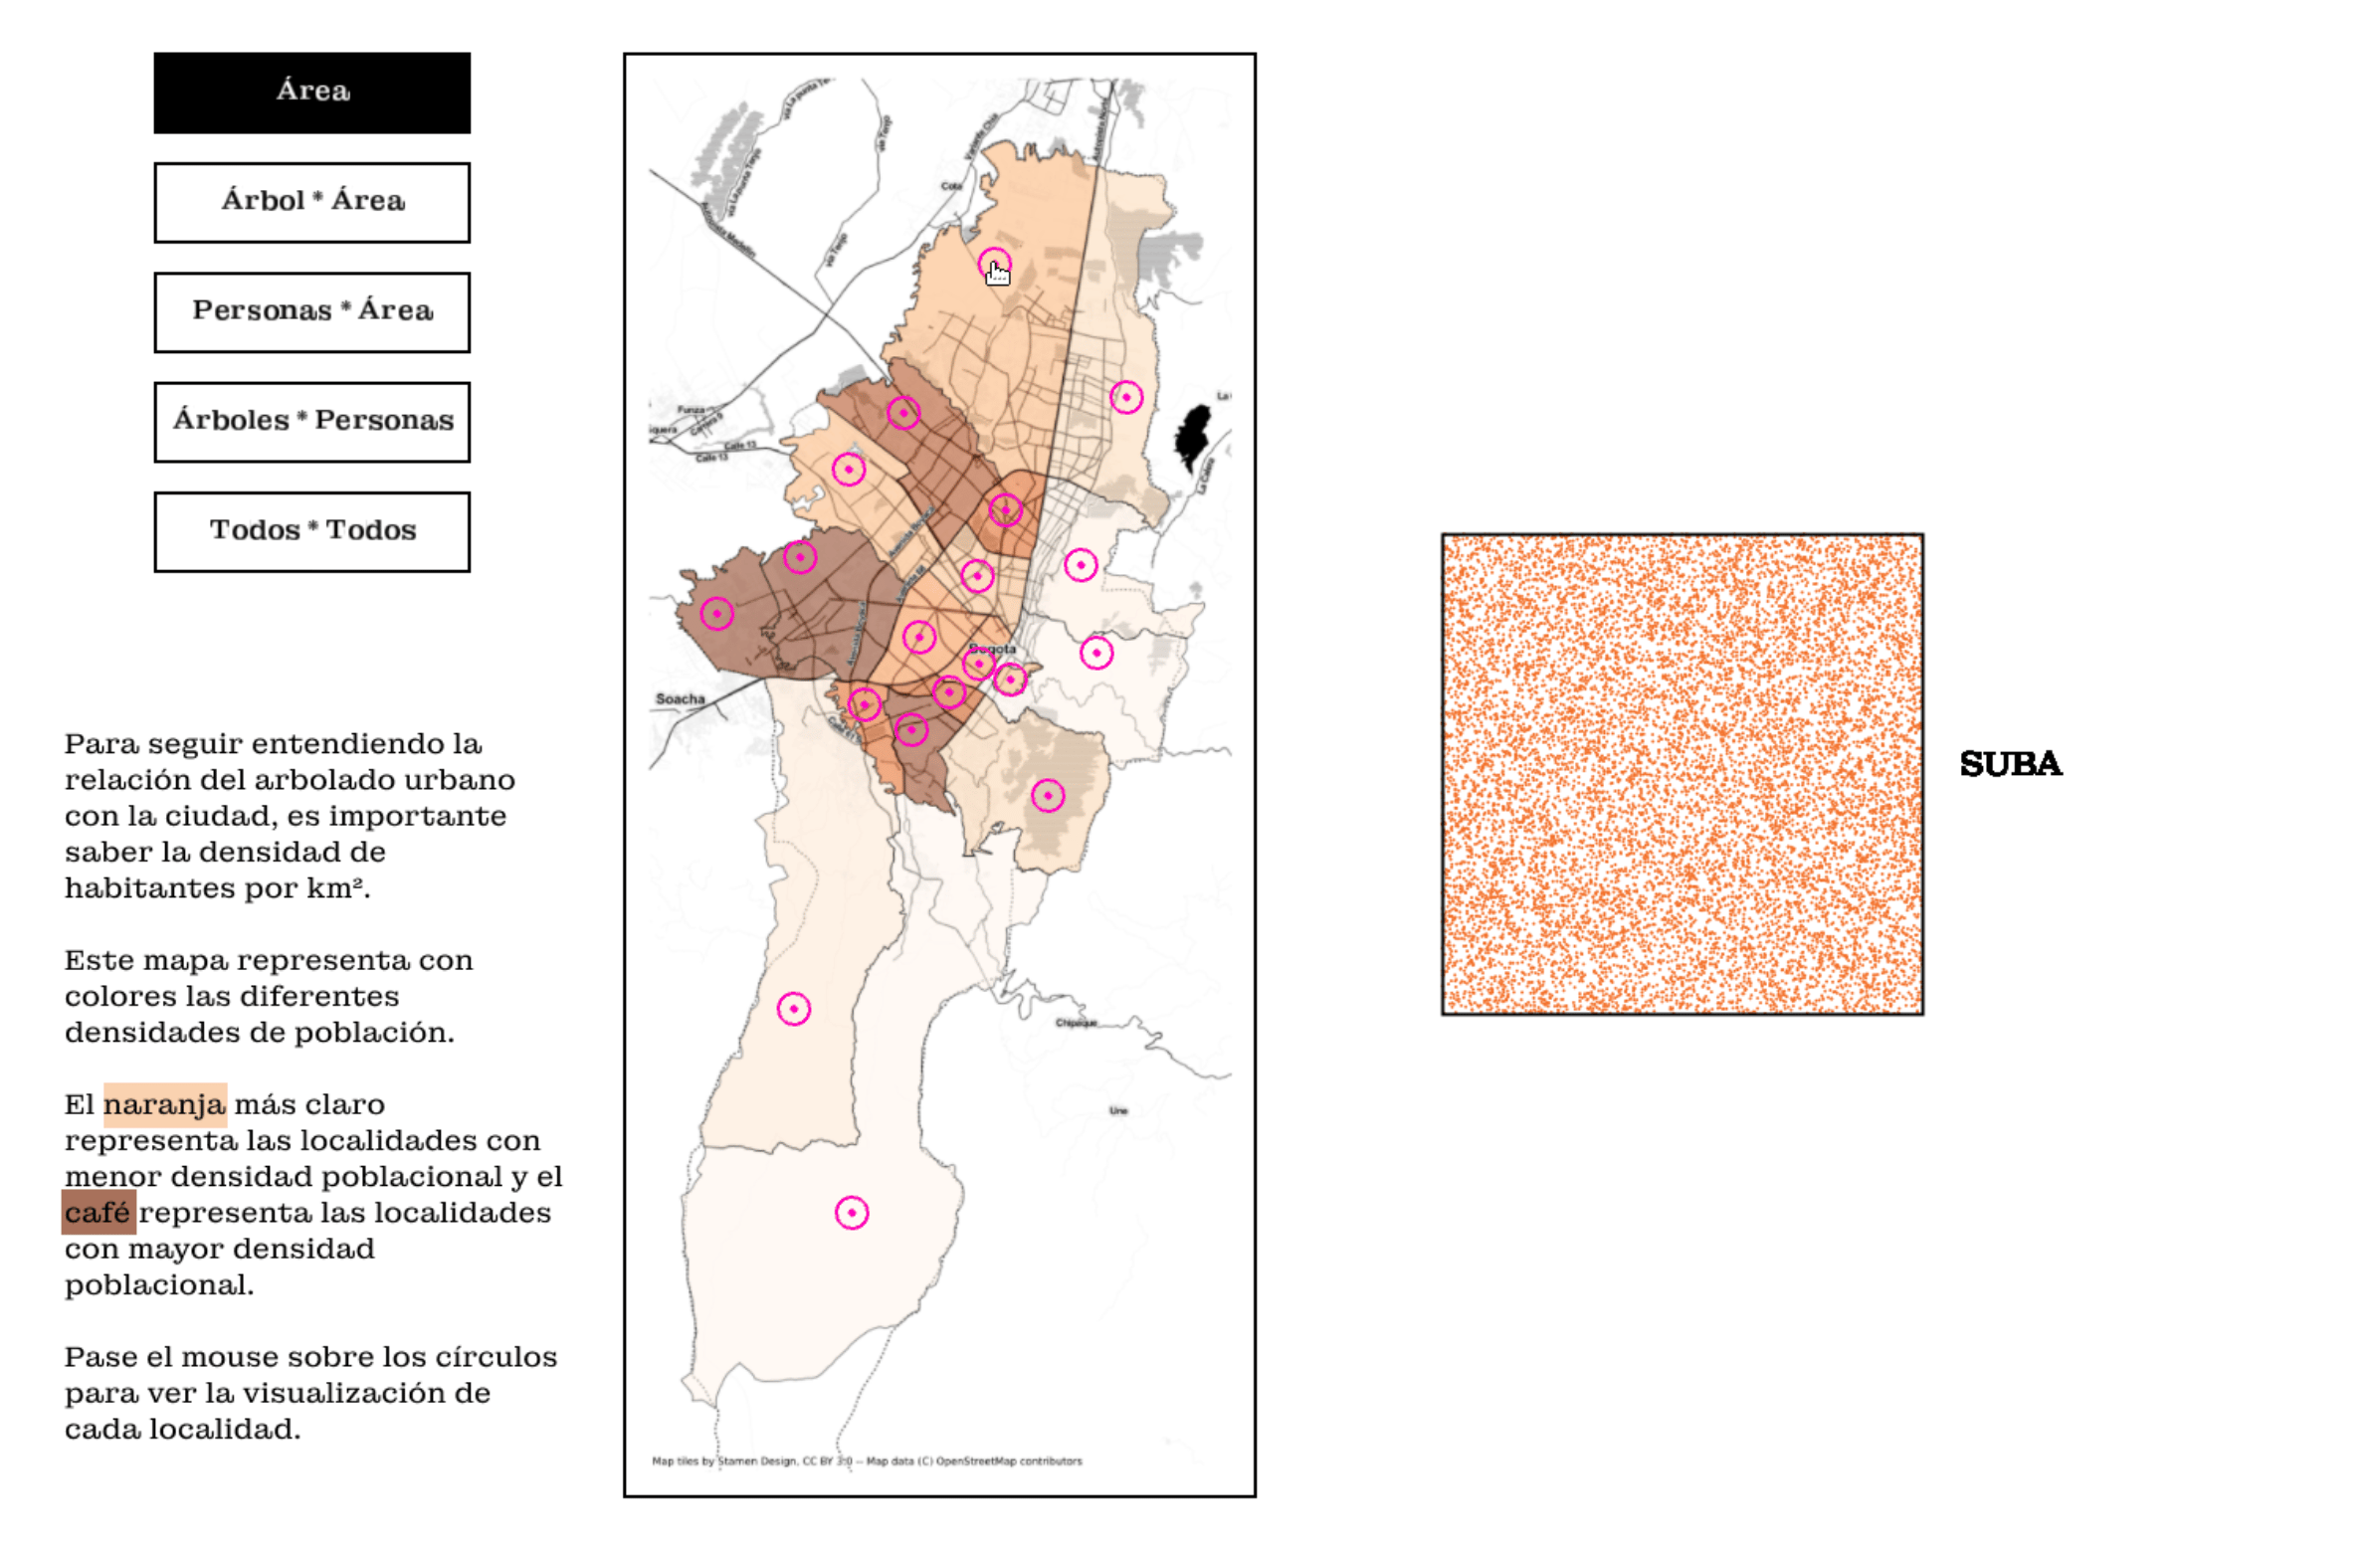
Population density per locality
The second layer introduces the human side of the equation, showing how many people occupy each locality relative to its size.
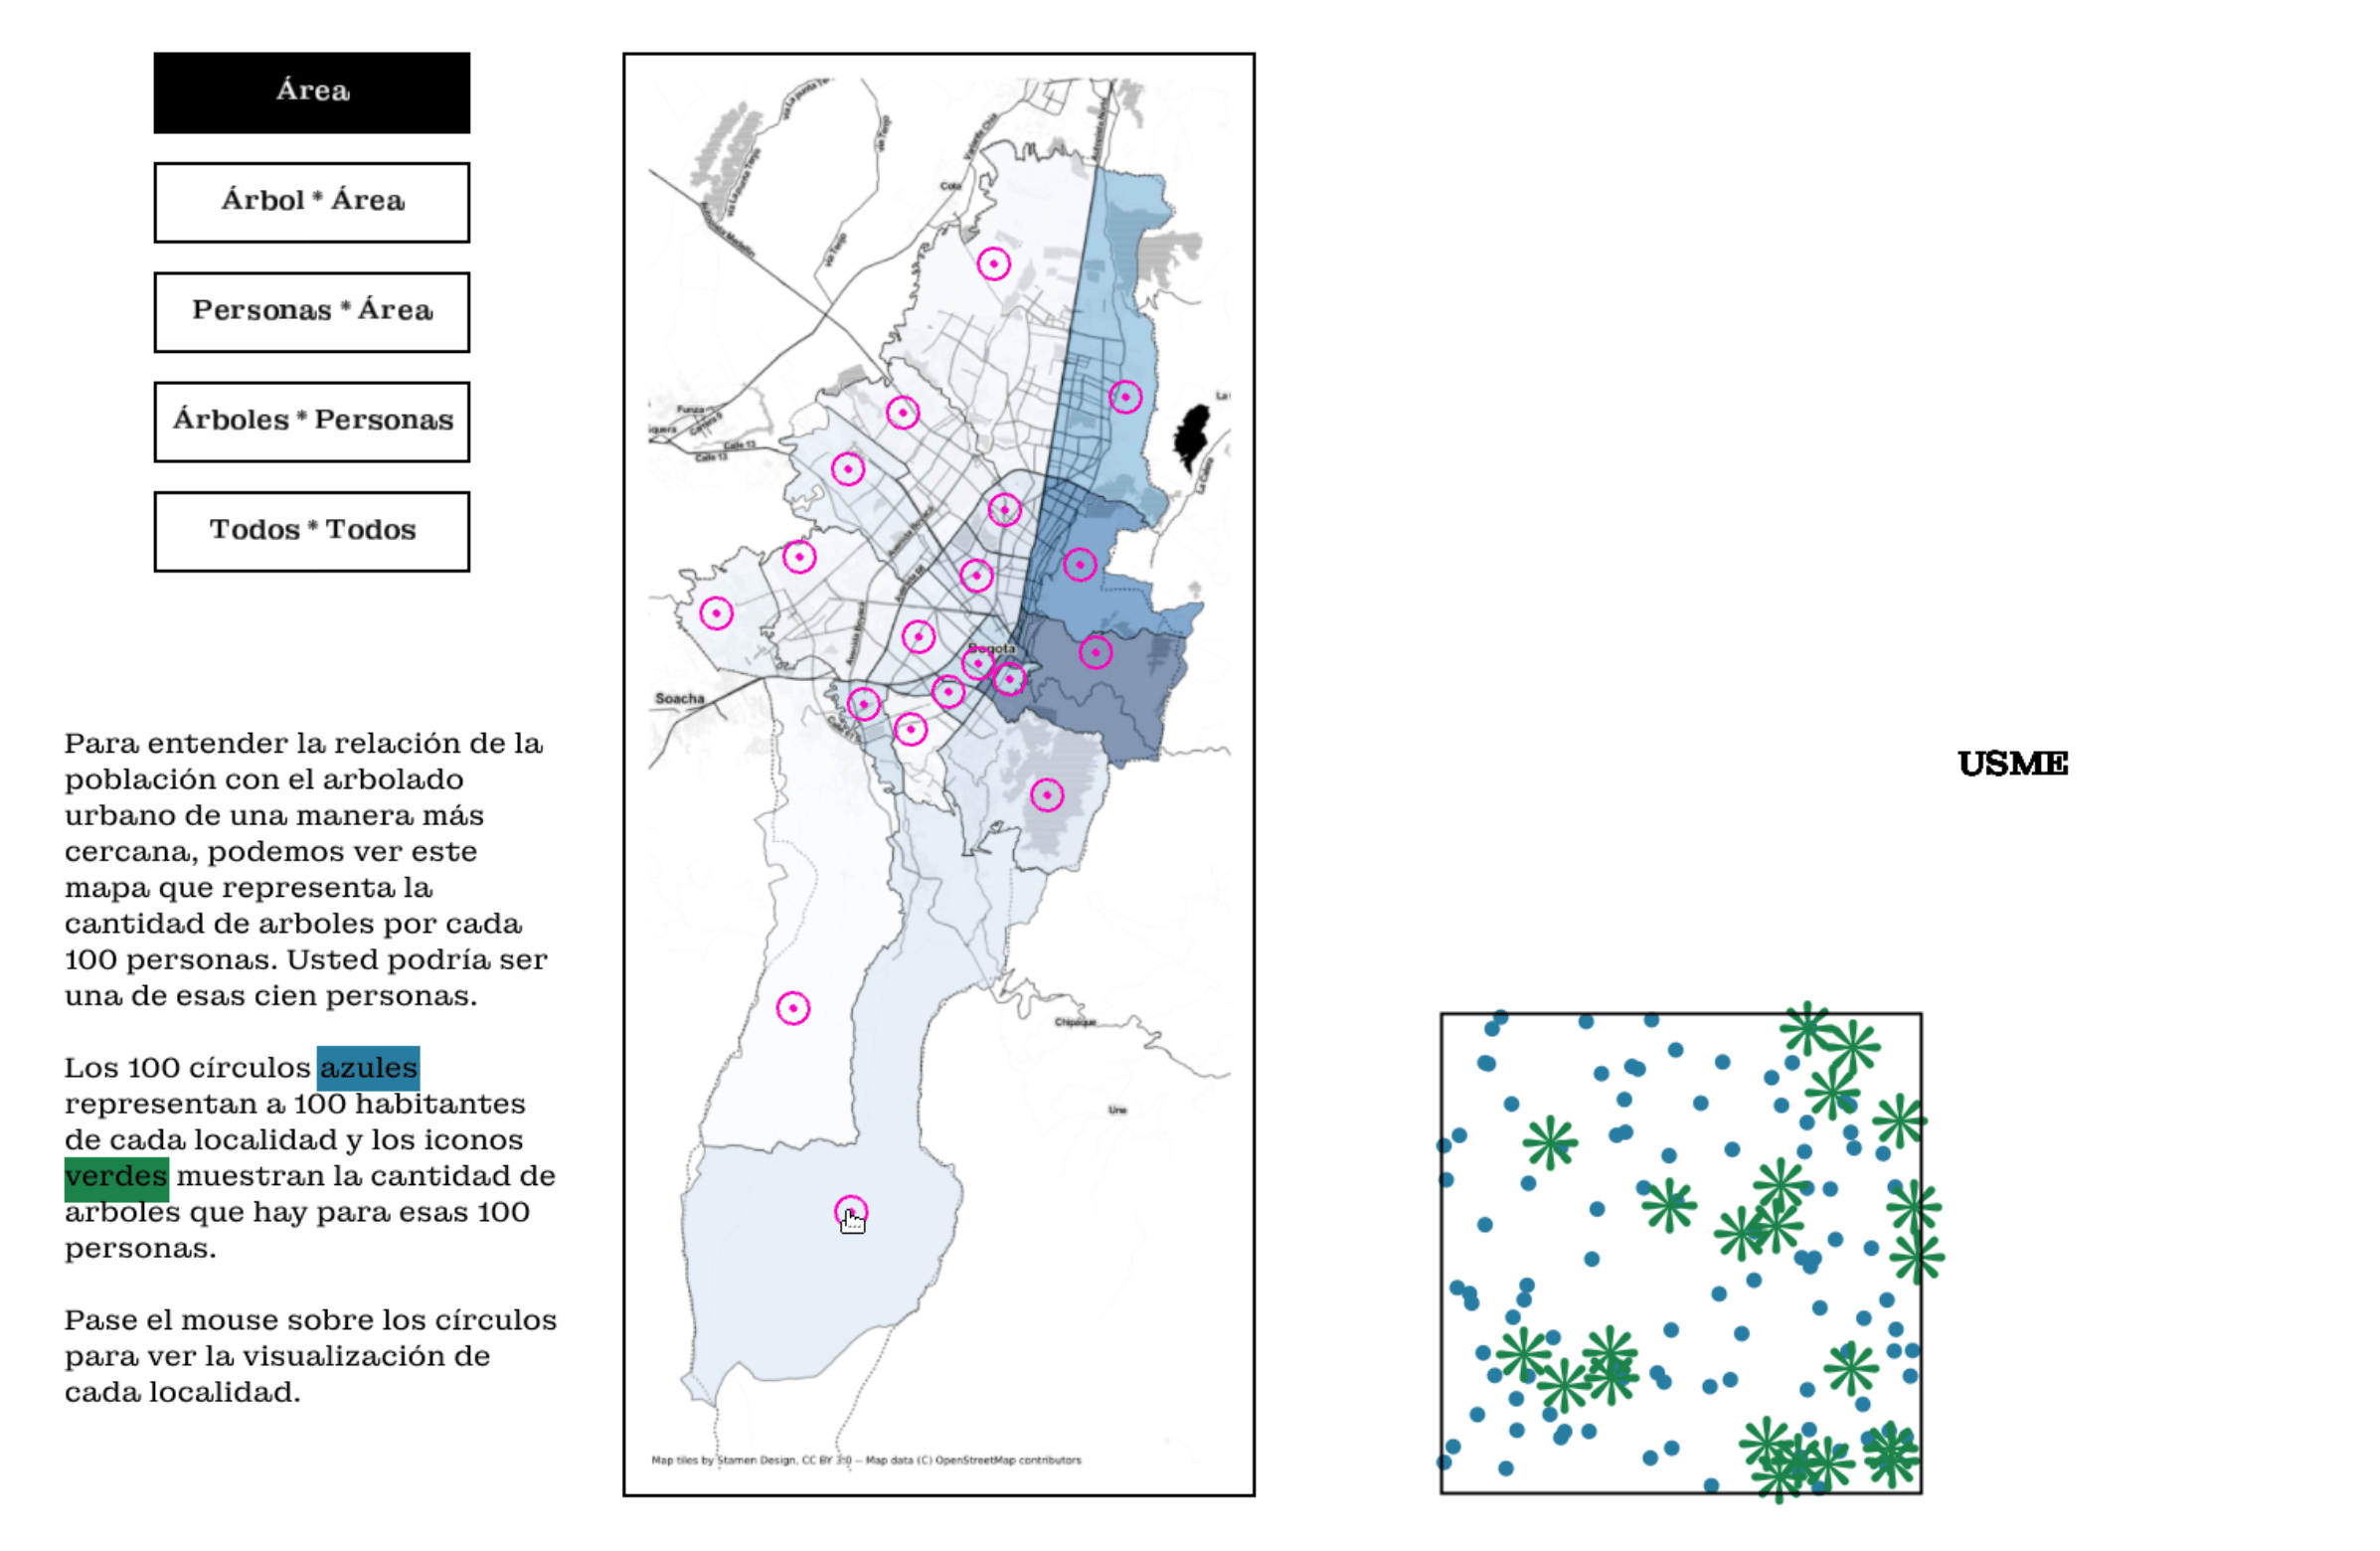
Trees per 100 people
The third layer brings both datasets together, showing how many trees exist for every 100 people in each locality. This is where the inequality becomes most visible.
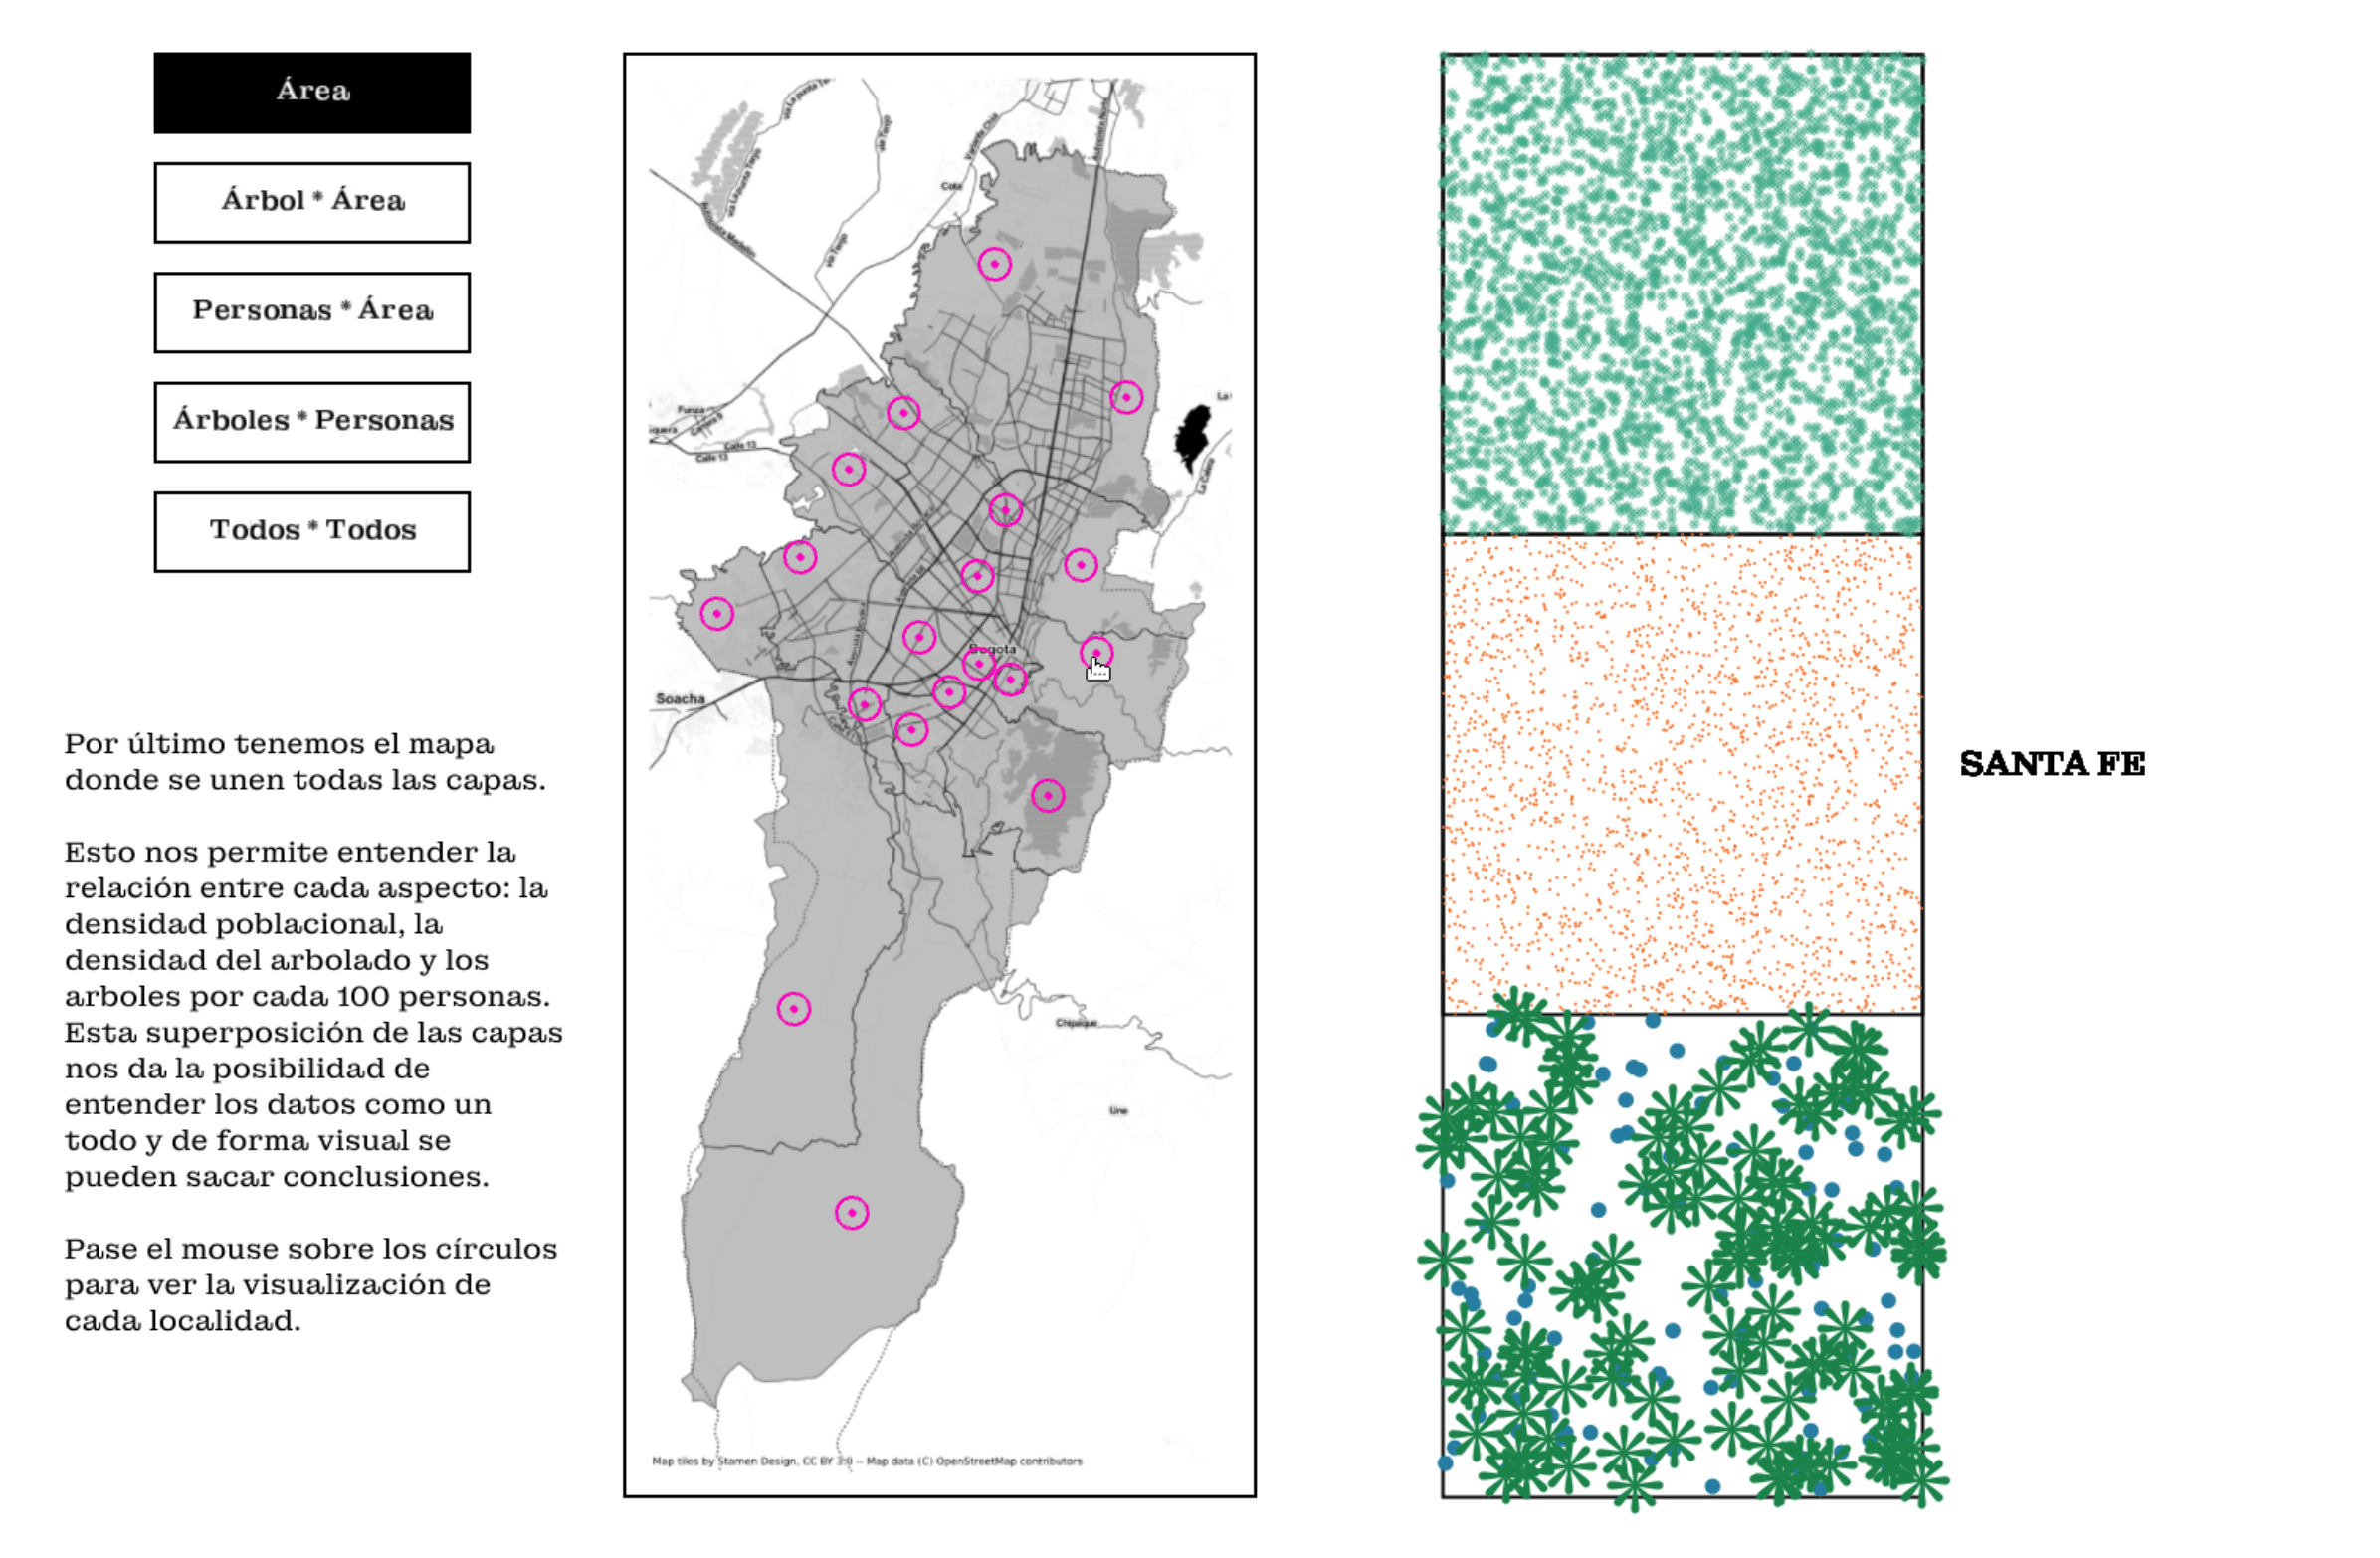
Combined view
The final layer overlaps all three datasets into a single visualization, letting people compare realities across localities and draw their own conclusions about the city they think they know.
This project taught me how to abstract complex data into a compelling story, one where the interface doesn't just display information but gives it meaning. It was also one of the few projects where I designed and coded the final output myself, closing the gap between the design decision and the thing that actually runs. That experience changed how I think about the relationship between craft and implementation.